Telecommunications
Customer Churn Analysis
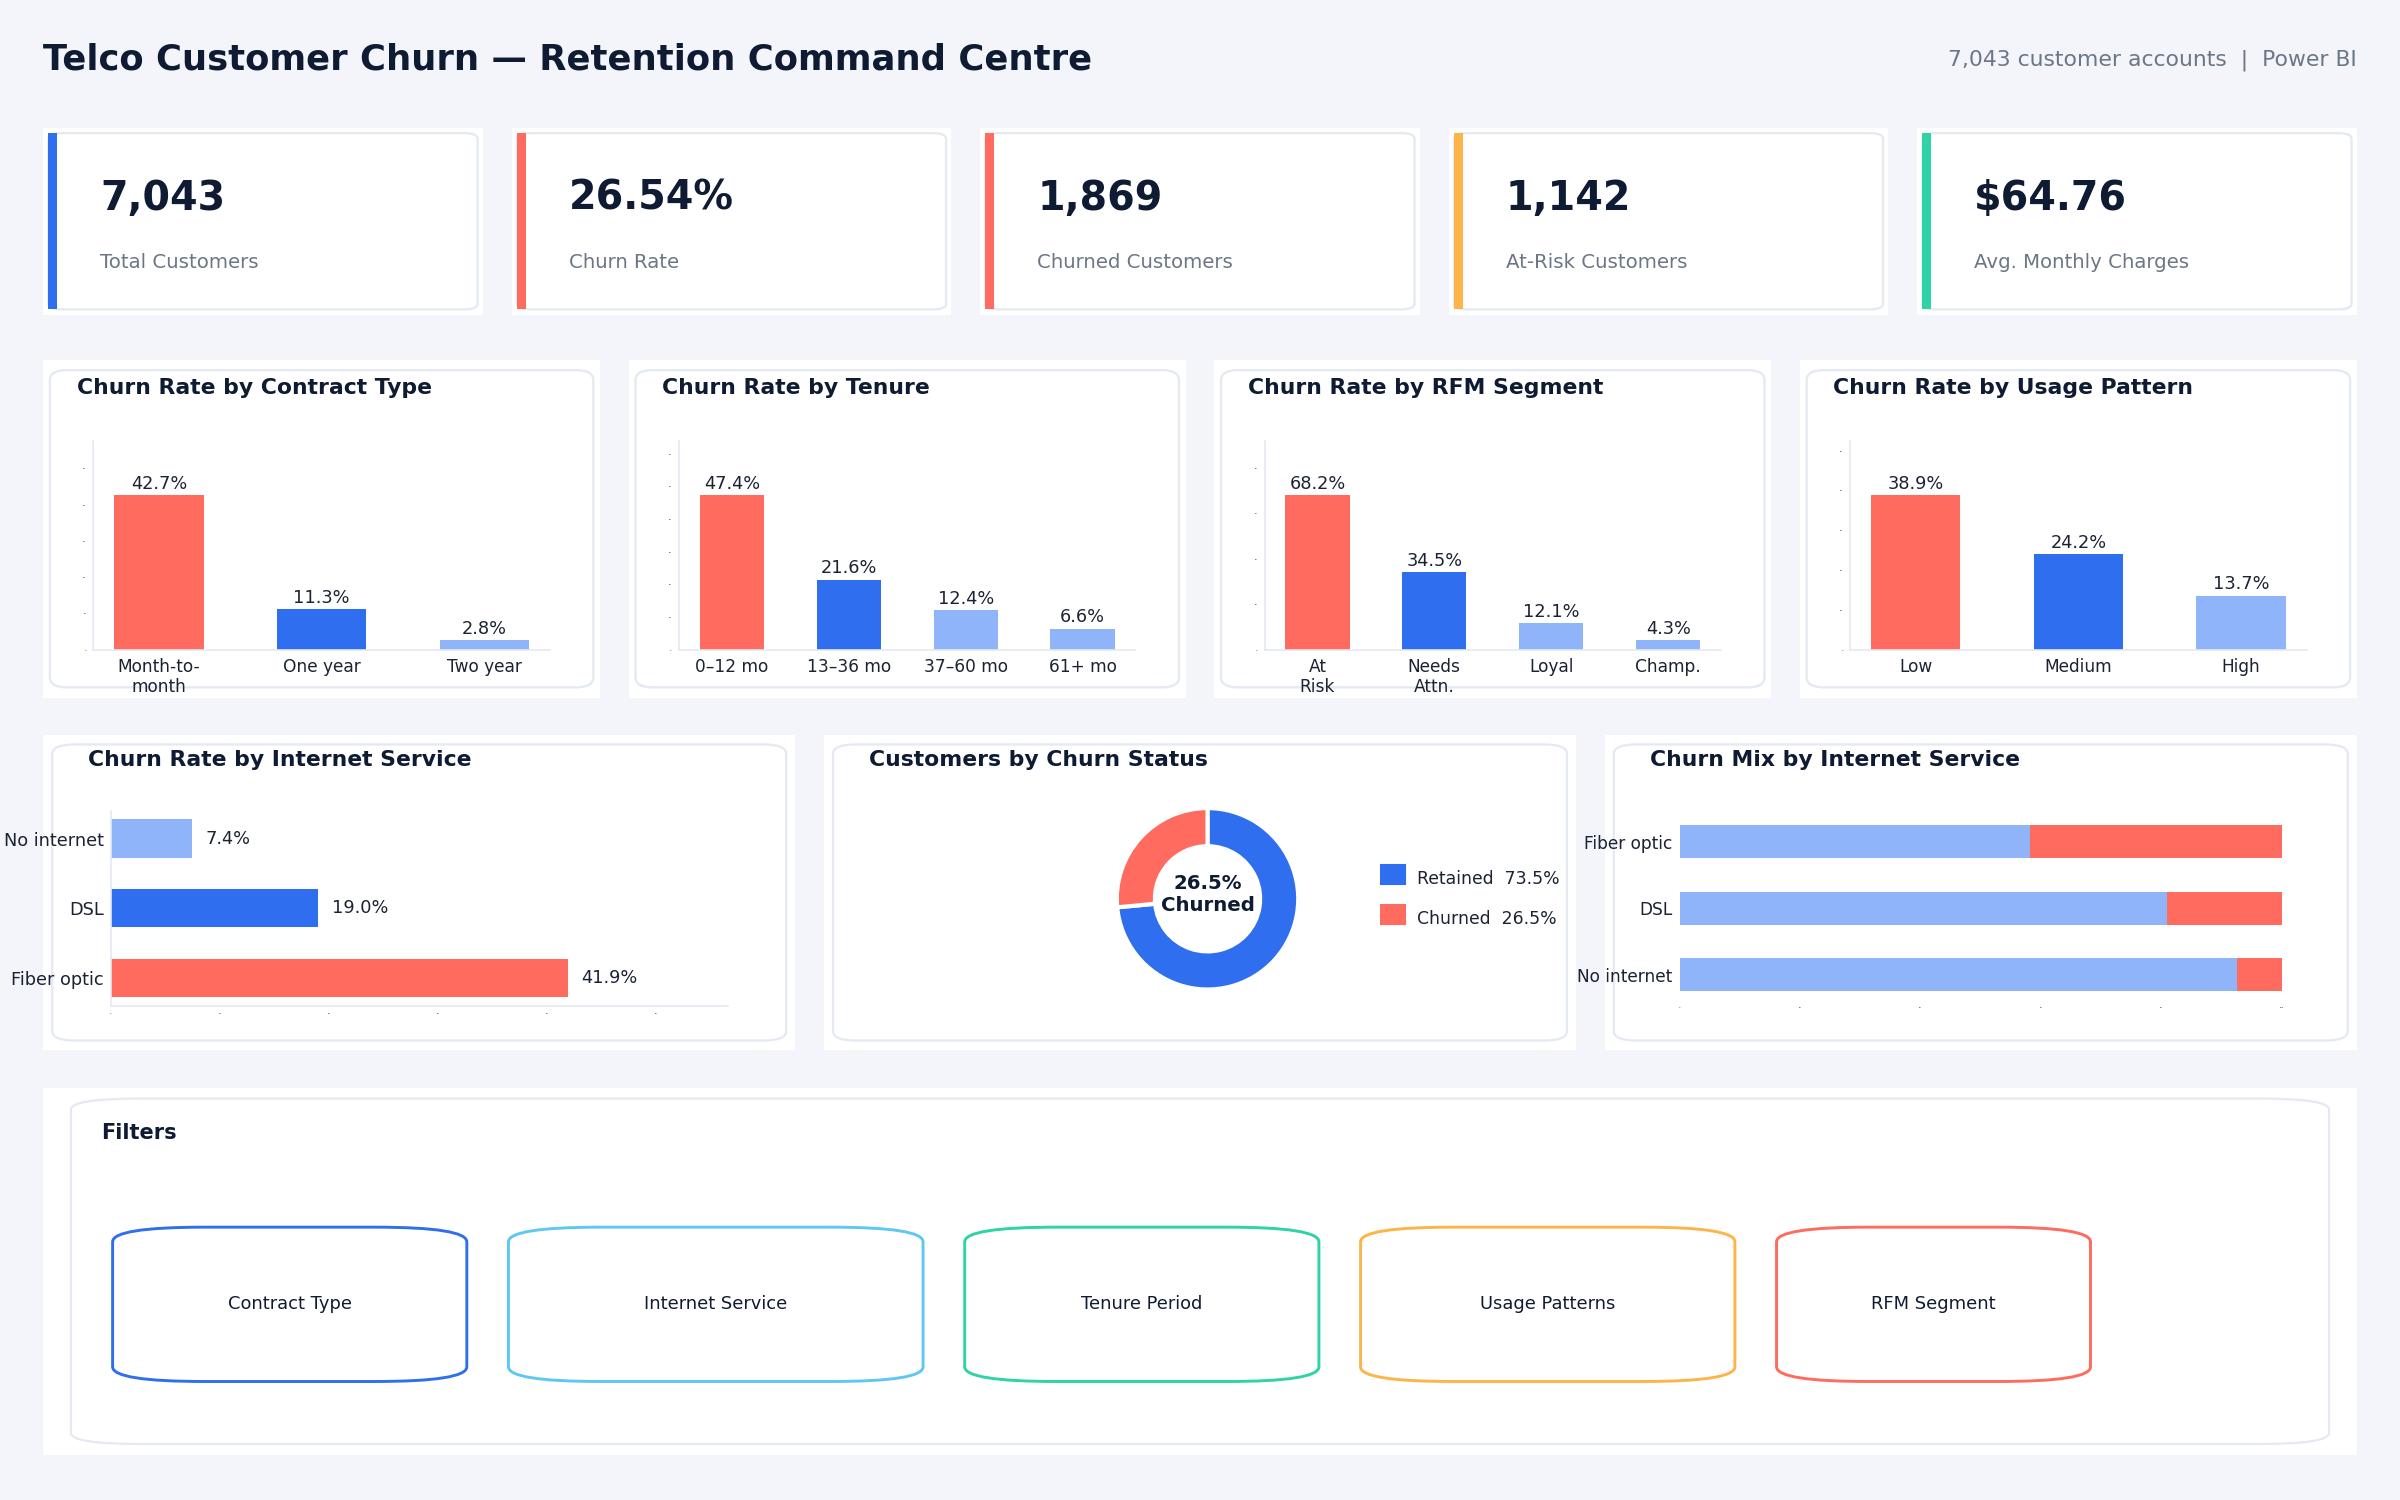
A single-page Power BI retention command centre that moves a telco from churn reporting to targeted retention action across 7,043 customer accounts.
Power BIPower QueryDAX
View Case StudyManufacturing · Multi-Entity Group
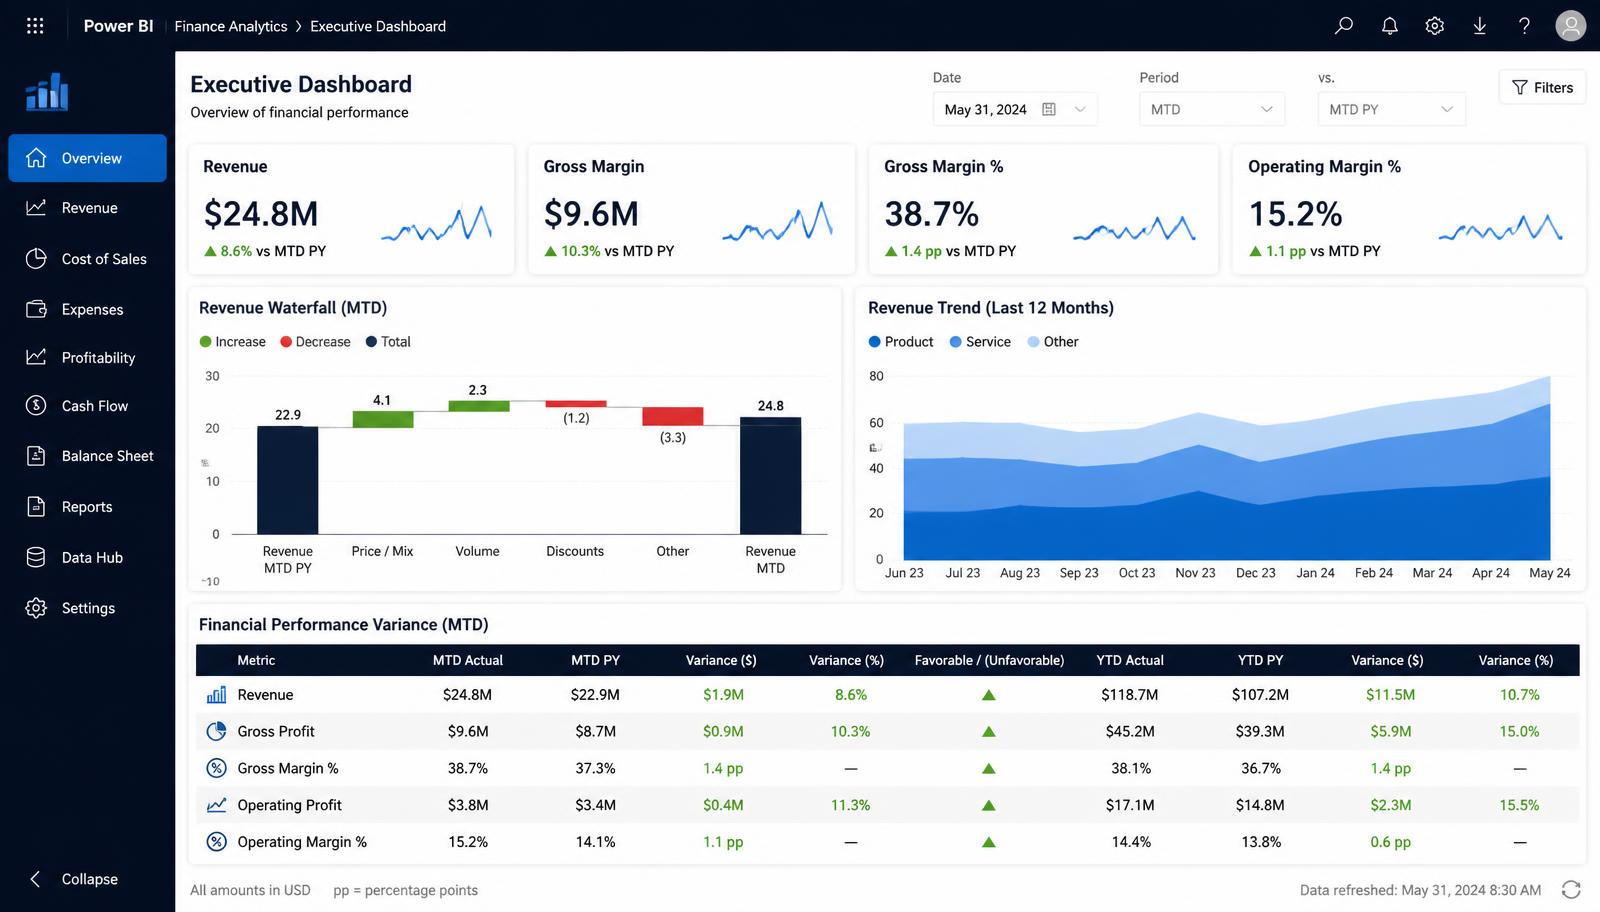
An executive finance cockpit consolidating revenue, margin and variance across four legal entities, cutting the month-end reporting cycle from nine days to two.
Business Problem
Month-end consolidation across four entities was a nine-day manual exercise. By the time the board pack was ready, the numbers described a quarter the business could no longer influence, and variance commentary was written from memory rather than evidence.
Our Approach
We automated the consolidation pipeline, standardised the chart of accounts mapping, and built a finance cockpit with revenue waterfall, margin bridge and an actual-versus-plan variance grid that drills from group to entity to cost centre.
Methodology
Standardise
Unified chart-of-accounts mapping across the four entities.
Automate
Scheduled ingestion replacing manual workbook consolidation.
Bridge
Price, volume, mix and discount decomposition of revenue movement.
Report
Group-to-cost-centre variance grid with favourable/unfavourable flags.
Govern
Reconciliation checks published alongside every refresh.
Key Findings
Business Recommendations
Results
9 → 2 days
Month-end cycle
4
Entities consolidated
100%
Automated reconciliation checks
Group → CC
Variance drill depth
Related Projects
Telecommunications
A single-page Power BI retention command centre that moves a telco from churn reporting to targeted retention action across 7,043 customer accounts.
B2B Distribution
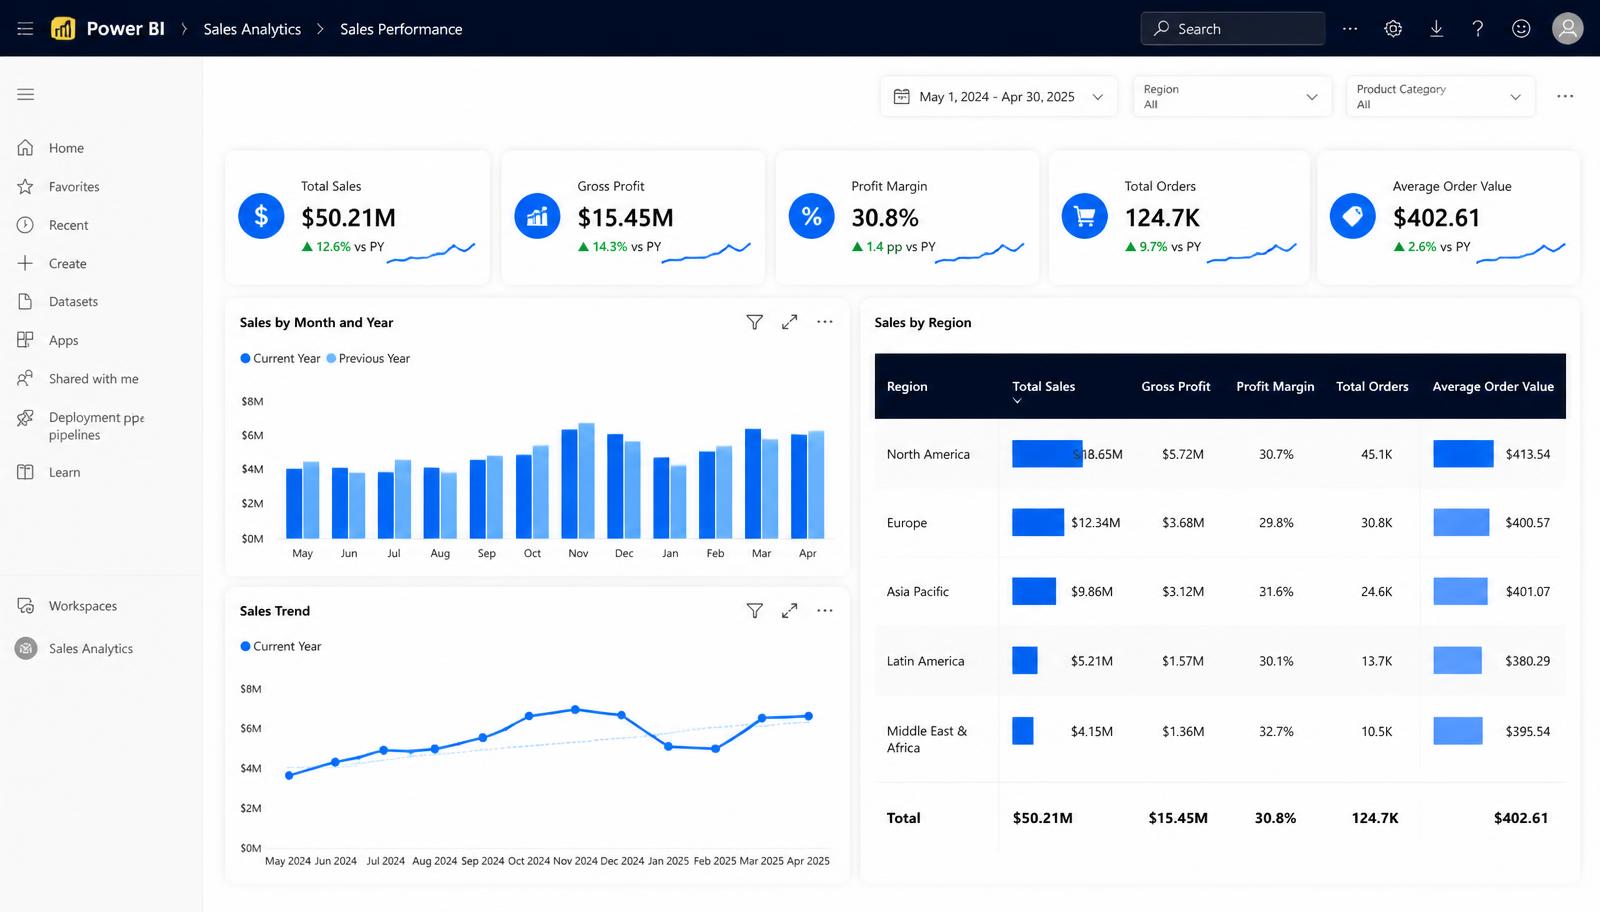
Region, rep and product performance consolidated into one governed Power BI model, replacing eleven conflicting spreadsheets in the weekly commercial review.