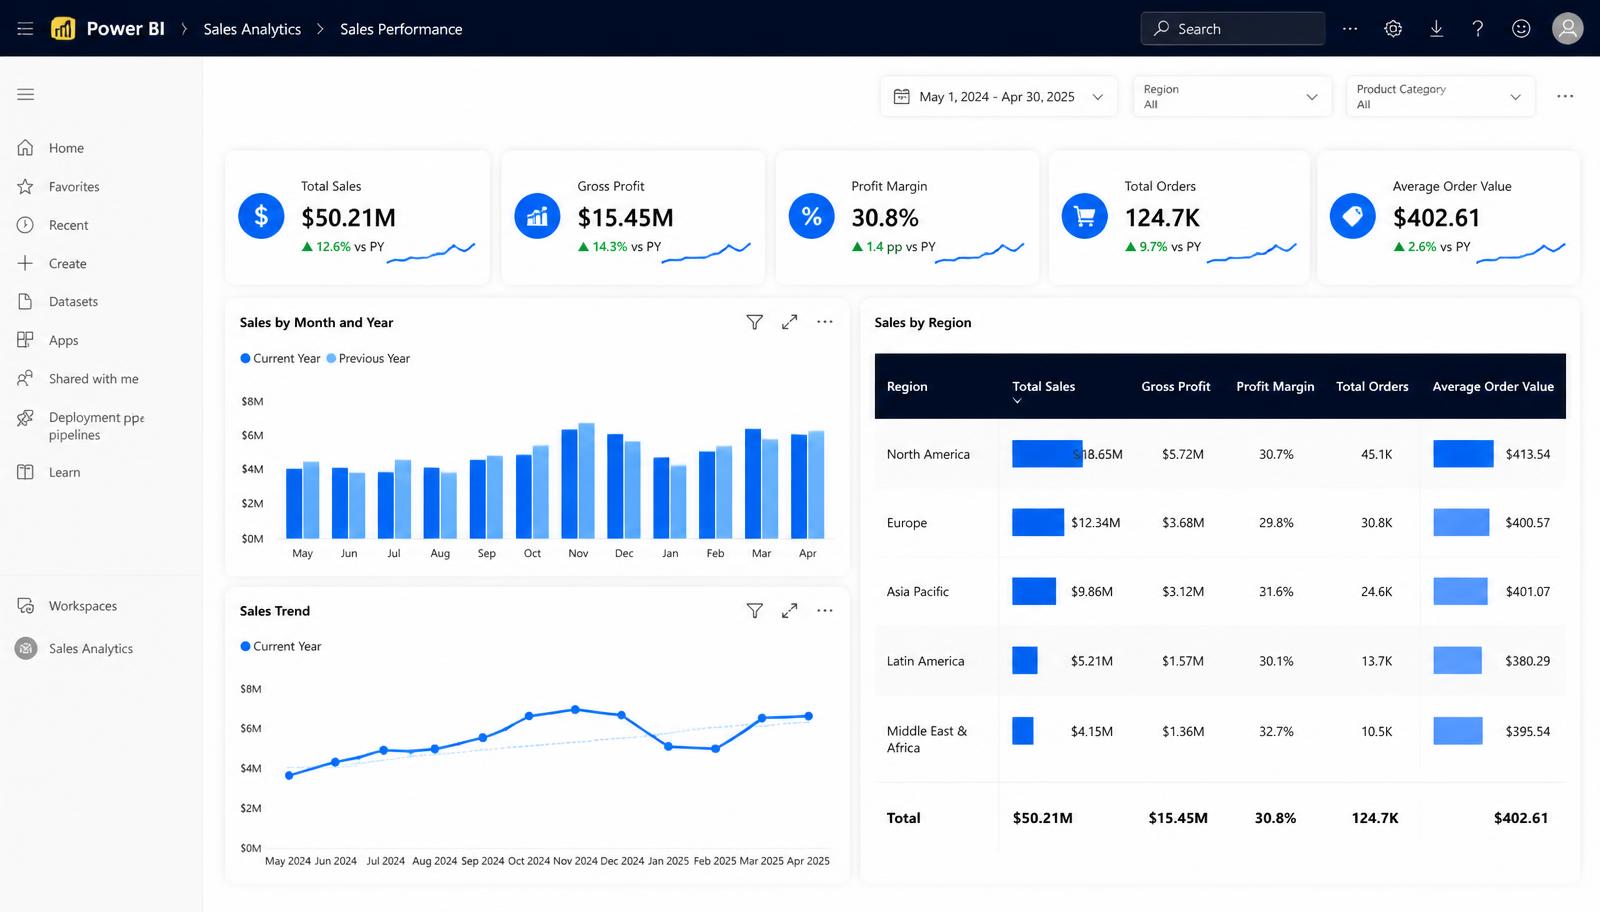
B2B Distribution
Sales Performance Dashboard
Region, rep and product performance consolidated into one governed Power BI model, replacing eleven conflicting spreadsheets in the weekly commercial review.
Power BIDAXSQL Server
View Case StudyTelecommunications · Enterprise Telco Operator
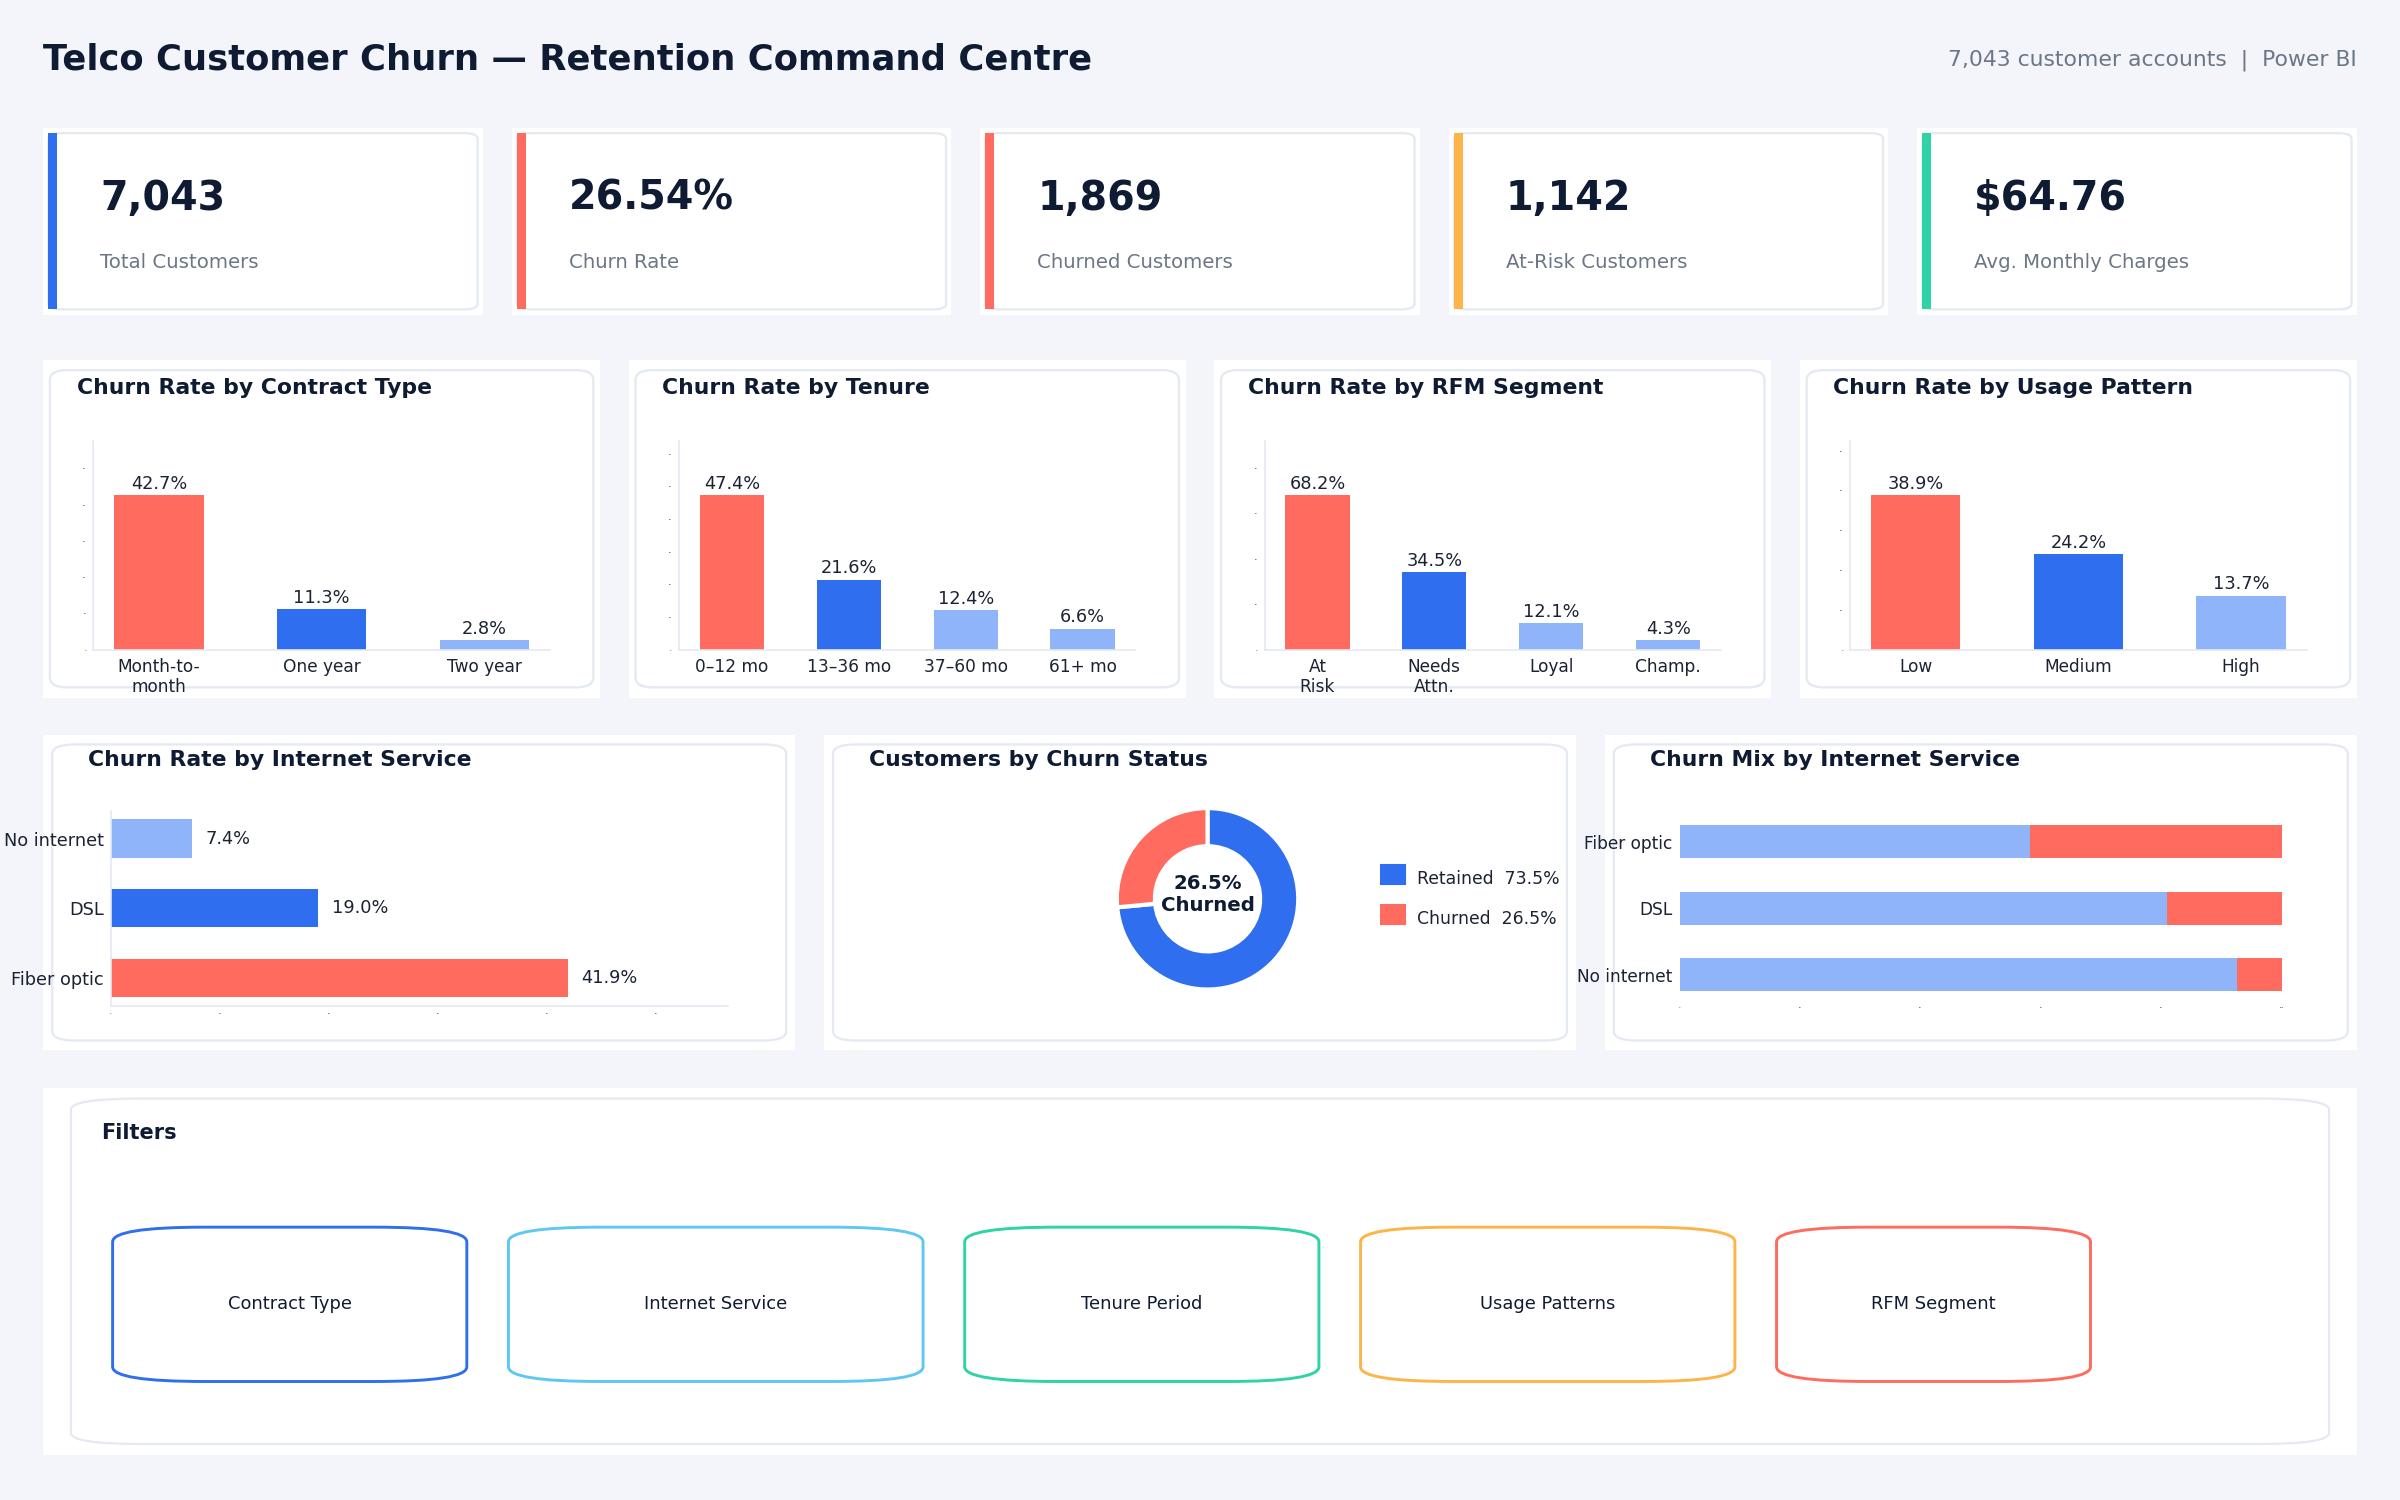
A single-page Power BI retention command centre that moves a telco from churn reporting to targeted retention action across 7,043 customer accounts.
Business Problem
Churn was being reported as a monthly percentage with no view of who was leaving or why. Leadership could see a 26.54% churn rate but had no way to translate it into a prioritised list of customers worth saving, so retention spend was spread evenly instead of where risk was concentrated.
Our Approach
We rebuilt the reporting layer around customer-level segmentation: Power Query standardisation, engineered contract, tenure and usage features, RFM-style scoring, and a one-page report combining headline KPIs, segment diagnostics, a service-mix heatmap and the contract-length relationship. The design principle was simple — segment first, explain second, recommend third.
Methodology
Clean
Power Query standardisation of account, contract and billing fields.
Engineer
Contract commitment, tenure bands and usage-pattern features.
Score
RFM-style customer segments to isolate higher-risk accounts.
Visualize
KPI cards, heatmap and clustered charts on a single decision page.
Decide
Risk tiers mapped to owned retention interventions.
Key Findings
Business Recommendations
Results
7,043
Customer accounts analysed
26.54%
Baseline churn rate quantified
3
Risk tiers mapped to owned actions
1 page
Executive decision surface
Related Projects
B2B Distribution
Region, rep and product performance consolidated into one governed Power BI model, replacing eleven conflicting spreadsheets in the weekly commercial review.
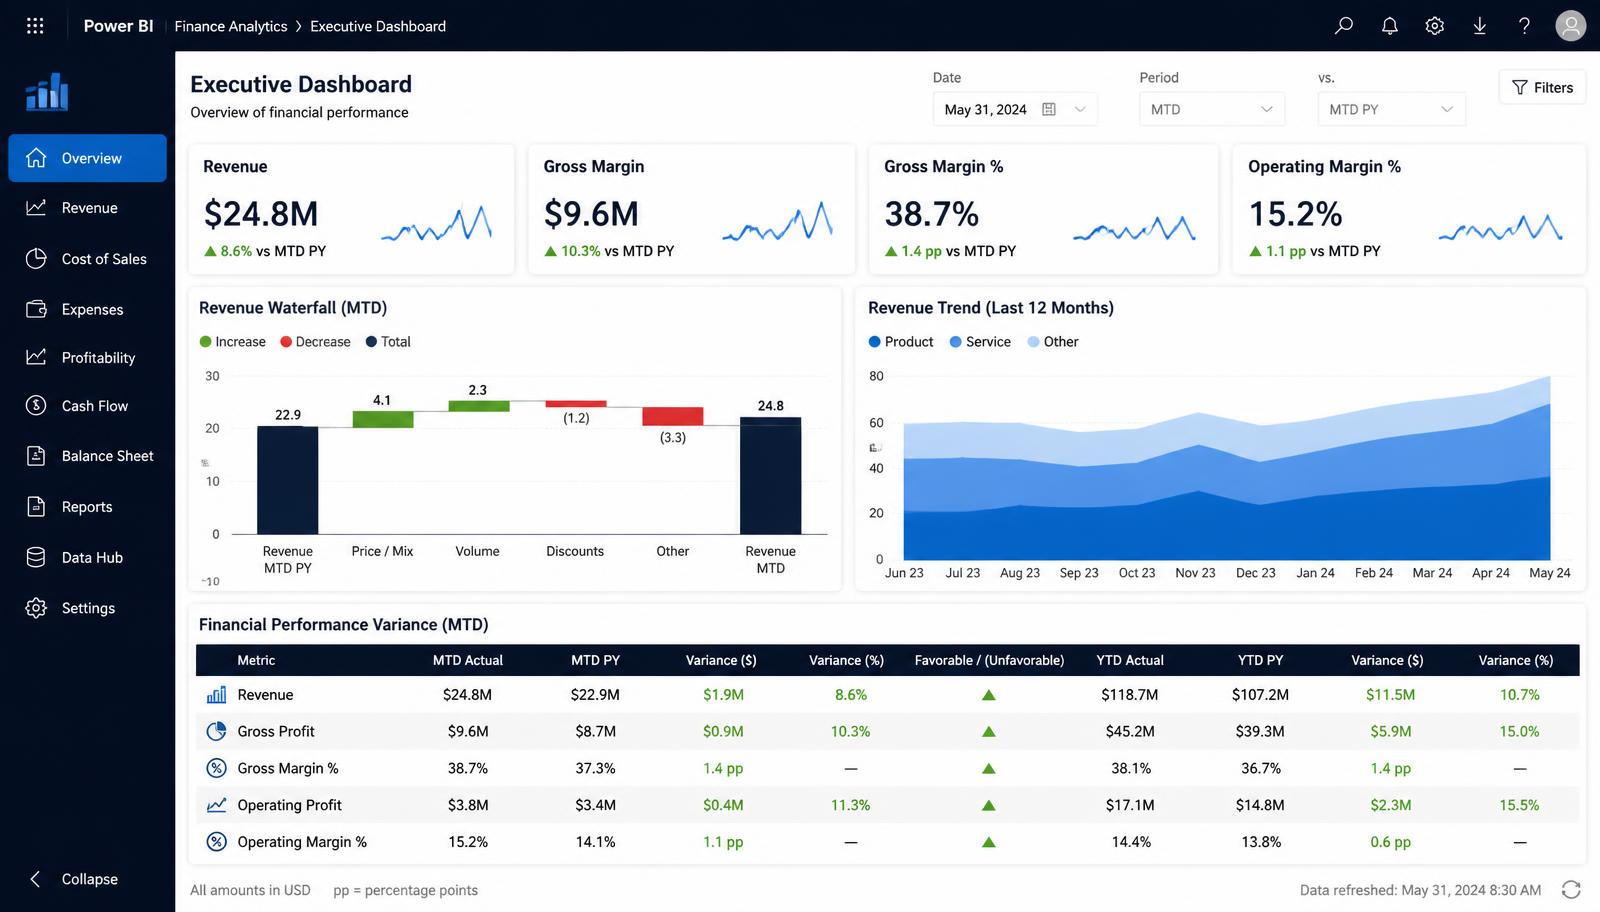
Manufacturing
An executive finance cockpit consolidating revenue, margin and variance across four legal entities, cutting the month-end reporting cycle from nine days to two.