Telecommunications
Customer Churn Analysis
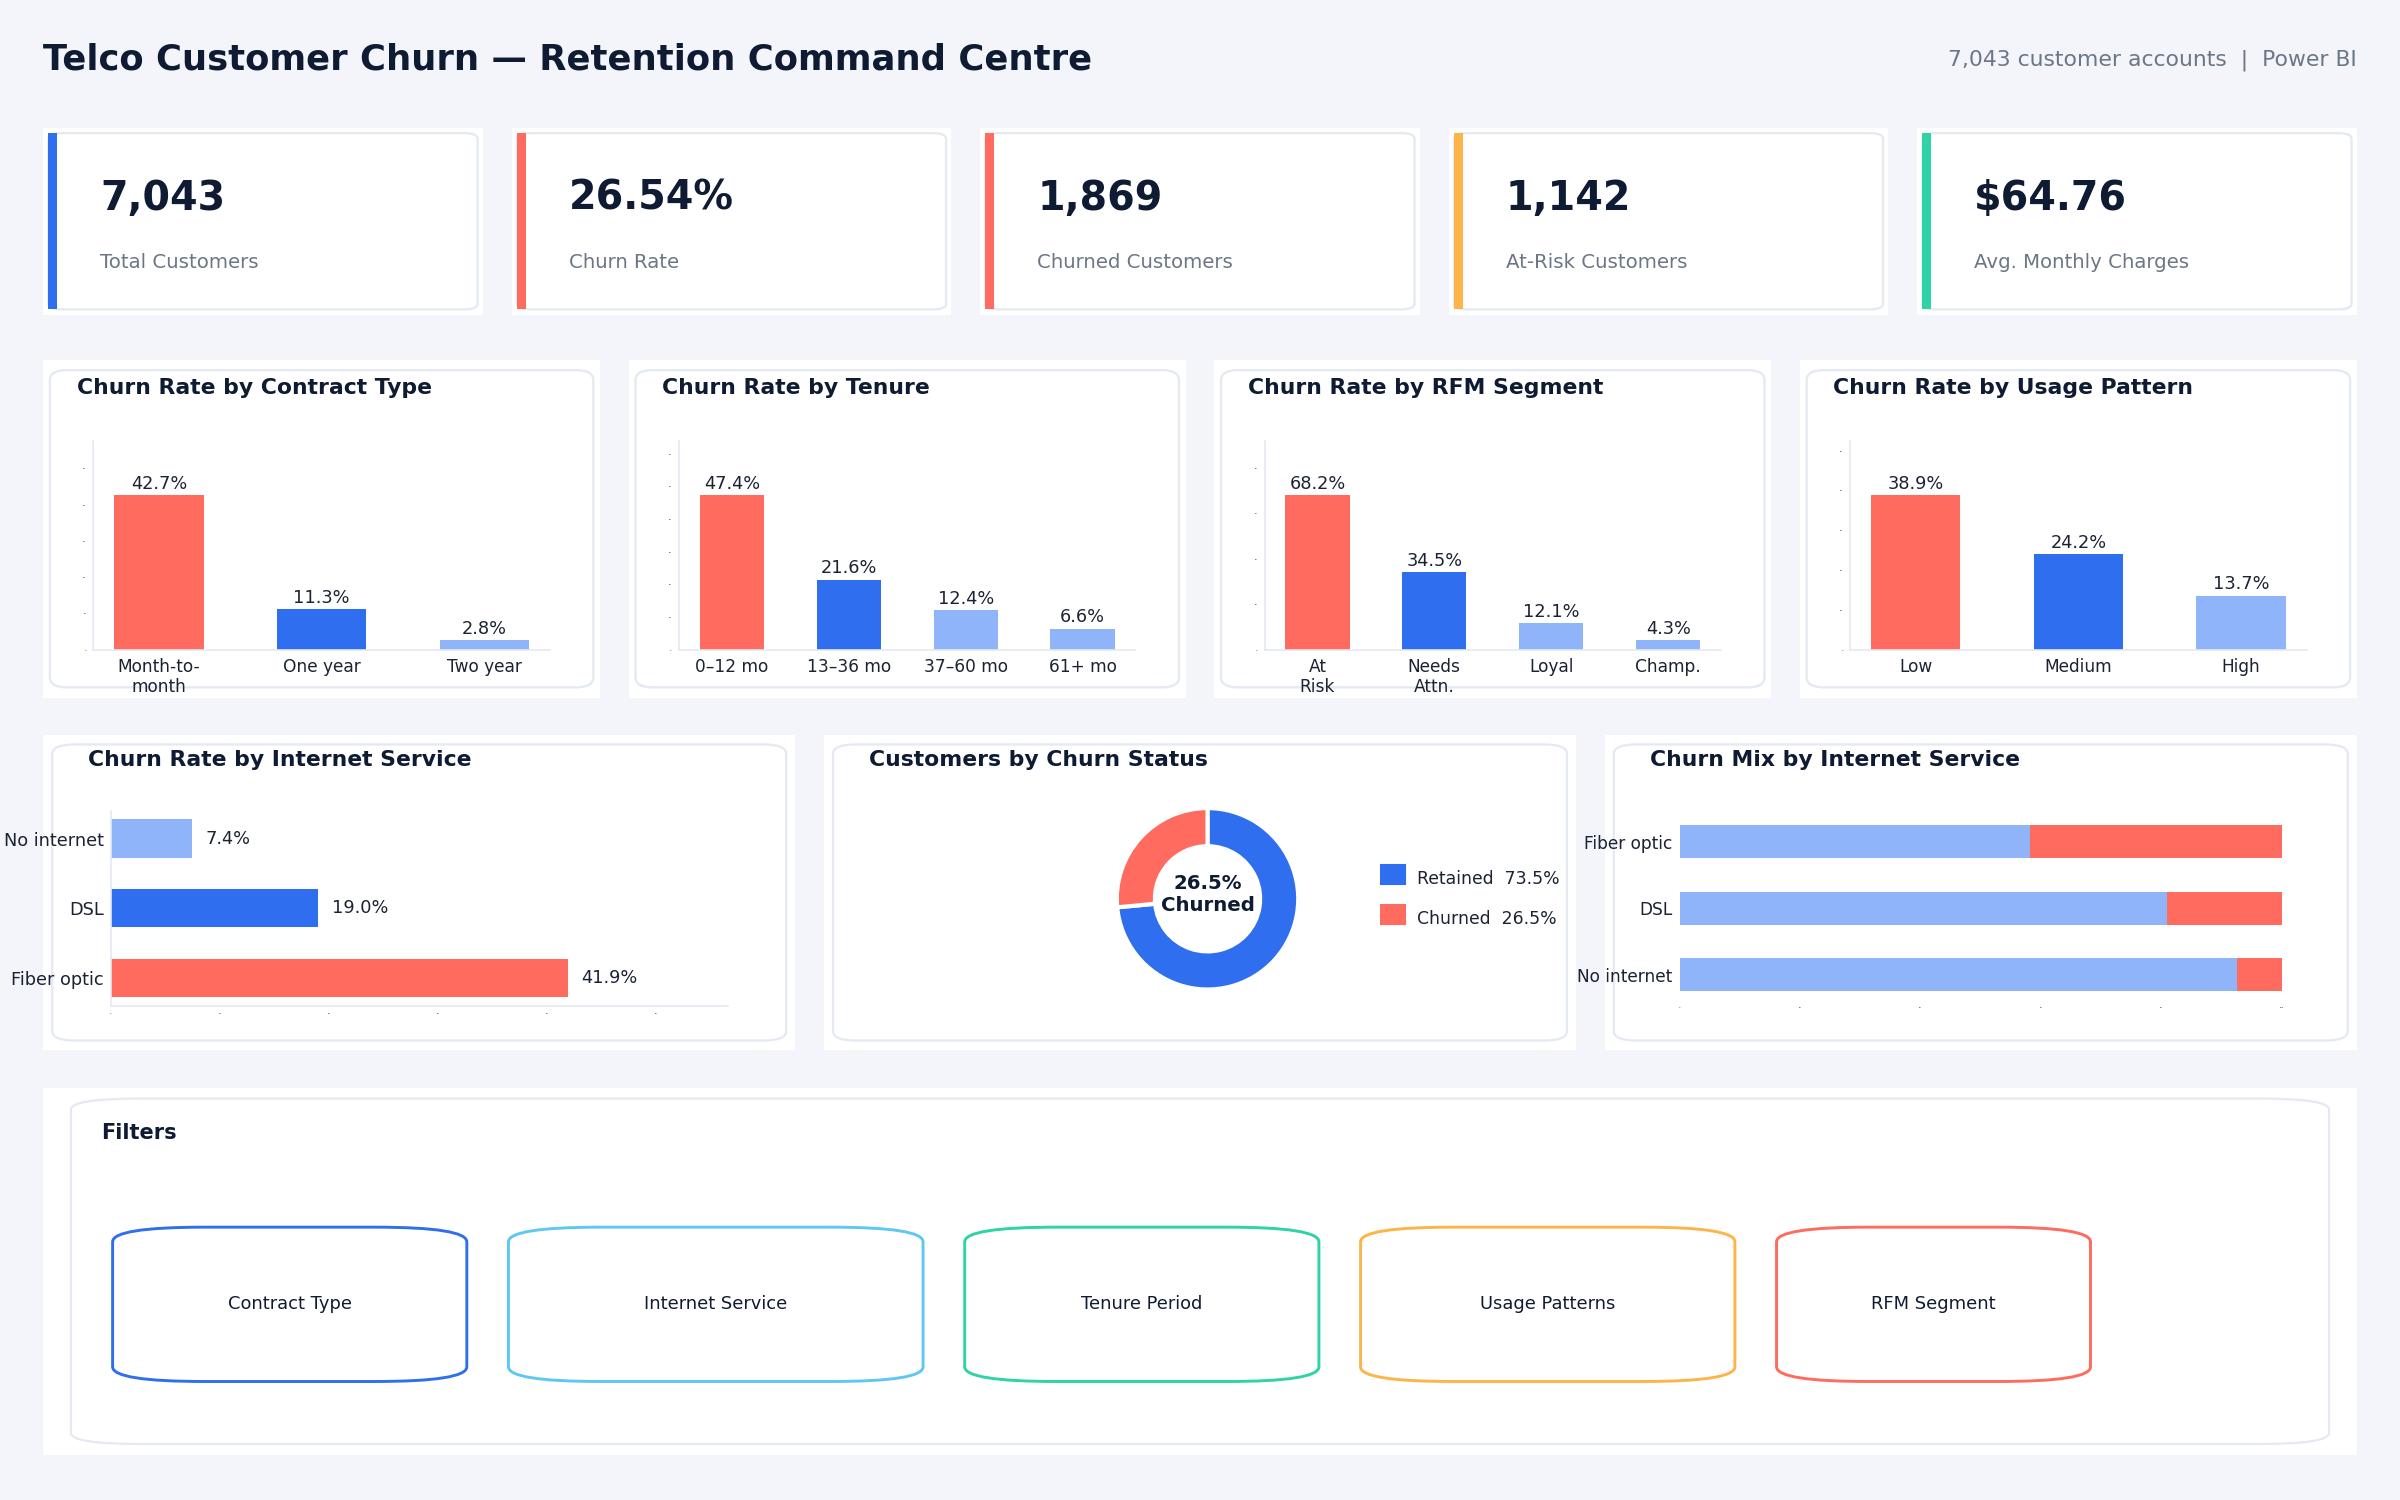
A single-page Power BI retention command centre that moves a telco from churn reporting to targeted retention action across 7,043 customer accounts.
Power BIPower QueryDAX
View Case StudyB2B Distribution · Mid-Market Distributor
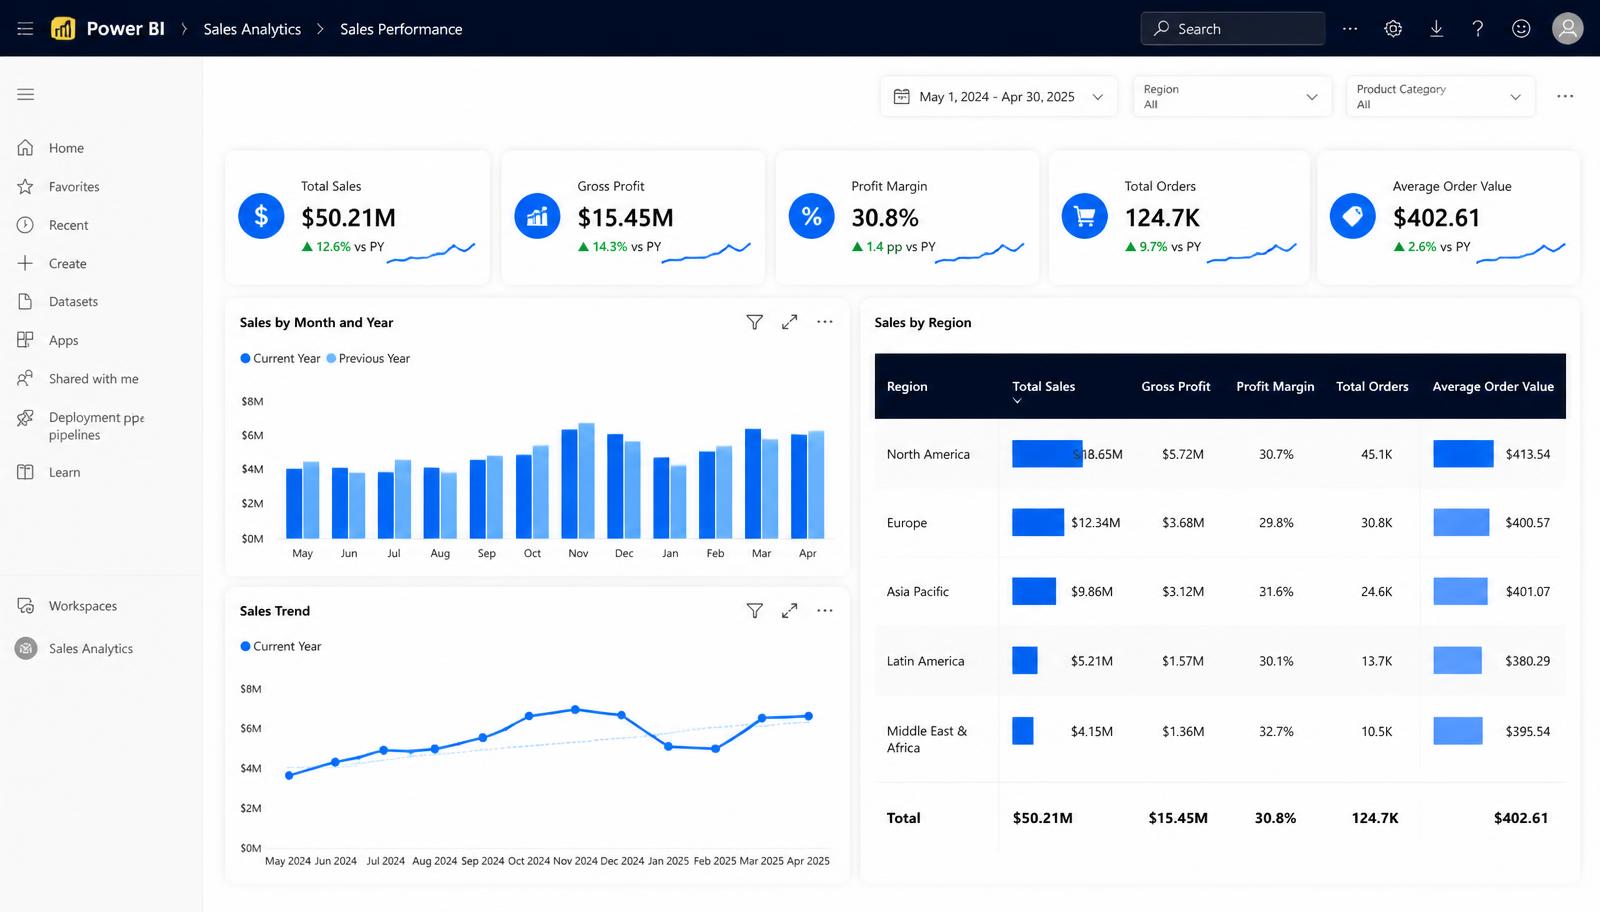
Region, rep and product performance consolidated into one governed Power BI model, replacing eleven conflicting spreadsheets in the weekly commercial review.
Business Problem
The commercial team ran its weekly review from eleven separate spreadsheets. Numbers rarely reconciled, pipeline coverage was calculated differently by each region, and the first twenty minutes of every meeting were spent arguing about the data rather than the decisions.
Our Approach
We built a single governed semantic model with certified DAX measures for revenue, margin, coverage and attainment, then delivered a three-layer report: an executive summary page, a regional drill-down and a rep-level scorecard with time intelligence built in.
Methodology
Audit
Mapped every existing spreadsheet metric and resolved definition conflicts.
Model
Star-schema semantic model over the SQL source with certified measures.
Measure
DAX time intelligence for YoY, MTD, QTD and attainment.
Design
Three-layer report structure from executive to rep level.
Adopt
Embedded the report into the weekly commercial operating rhythm.
Key Findings
Business Recommendations
Results
11 → 1
Spreadsheets replaced
-70%
Weekly reporting effort
Daily
Refresh cadence
3 layers
Executive to rep drill-down
Related Projects
Telecommunications
A single-page Power BI retention command centre that moves a telco from churn reporting to targeted retention action across 7,043 customer accounts.
Manufacturing
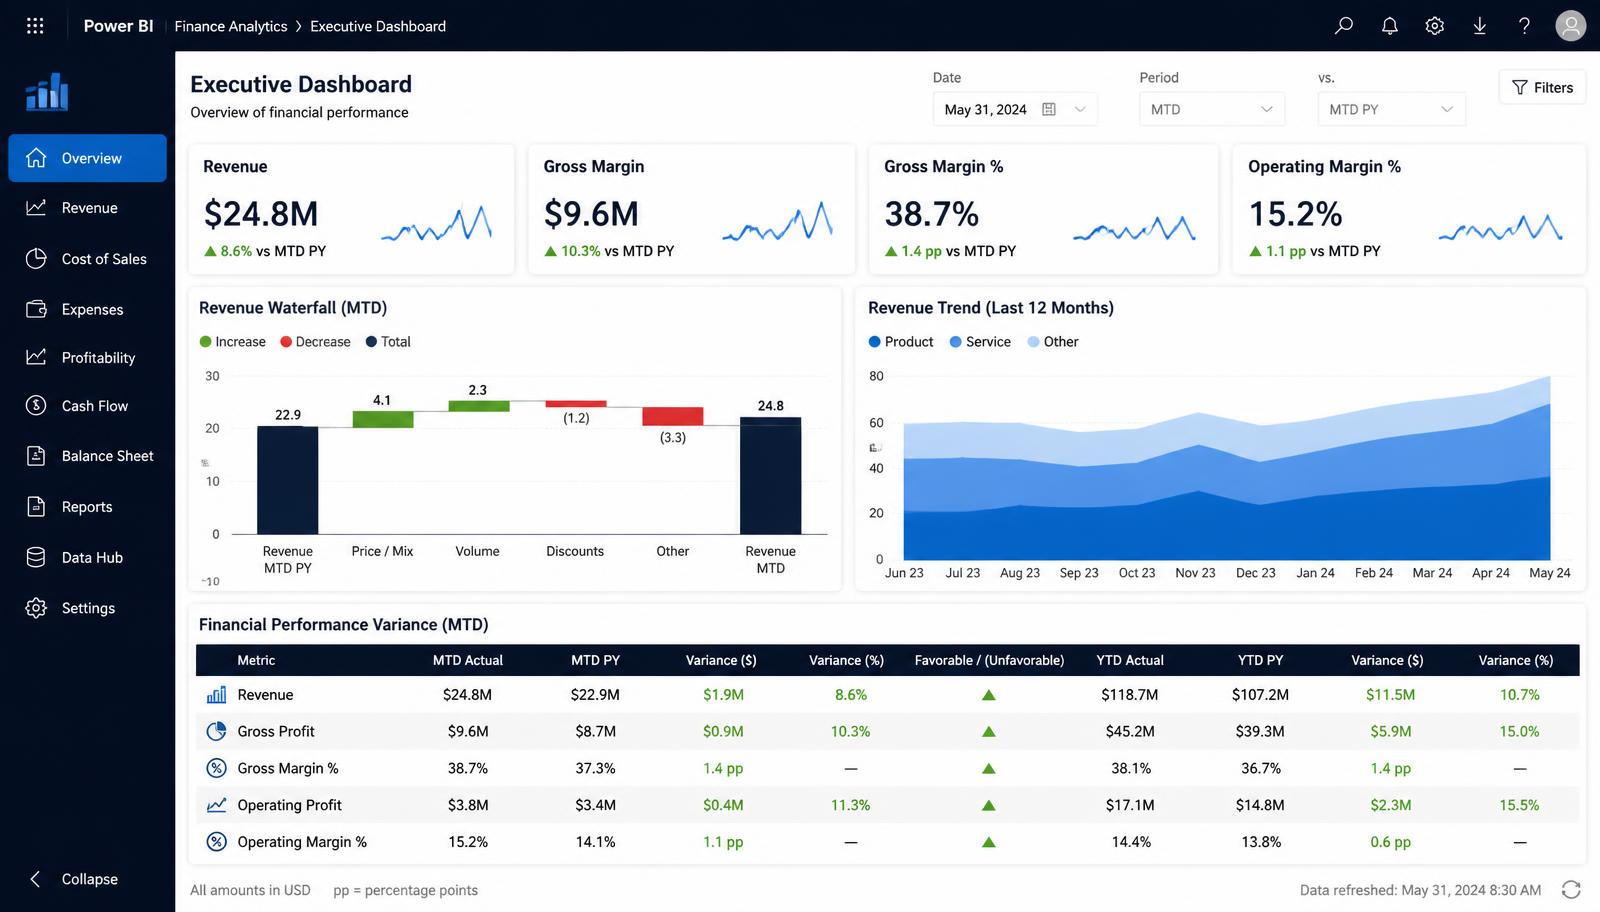
An executive finance cockpit consolidating revenue, margin and variance across four legal entities, cutting the month-end reporting cycle from nine days to two.